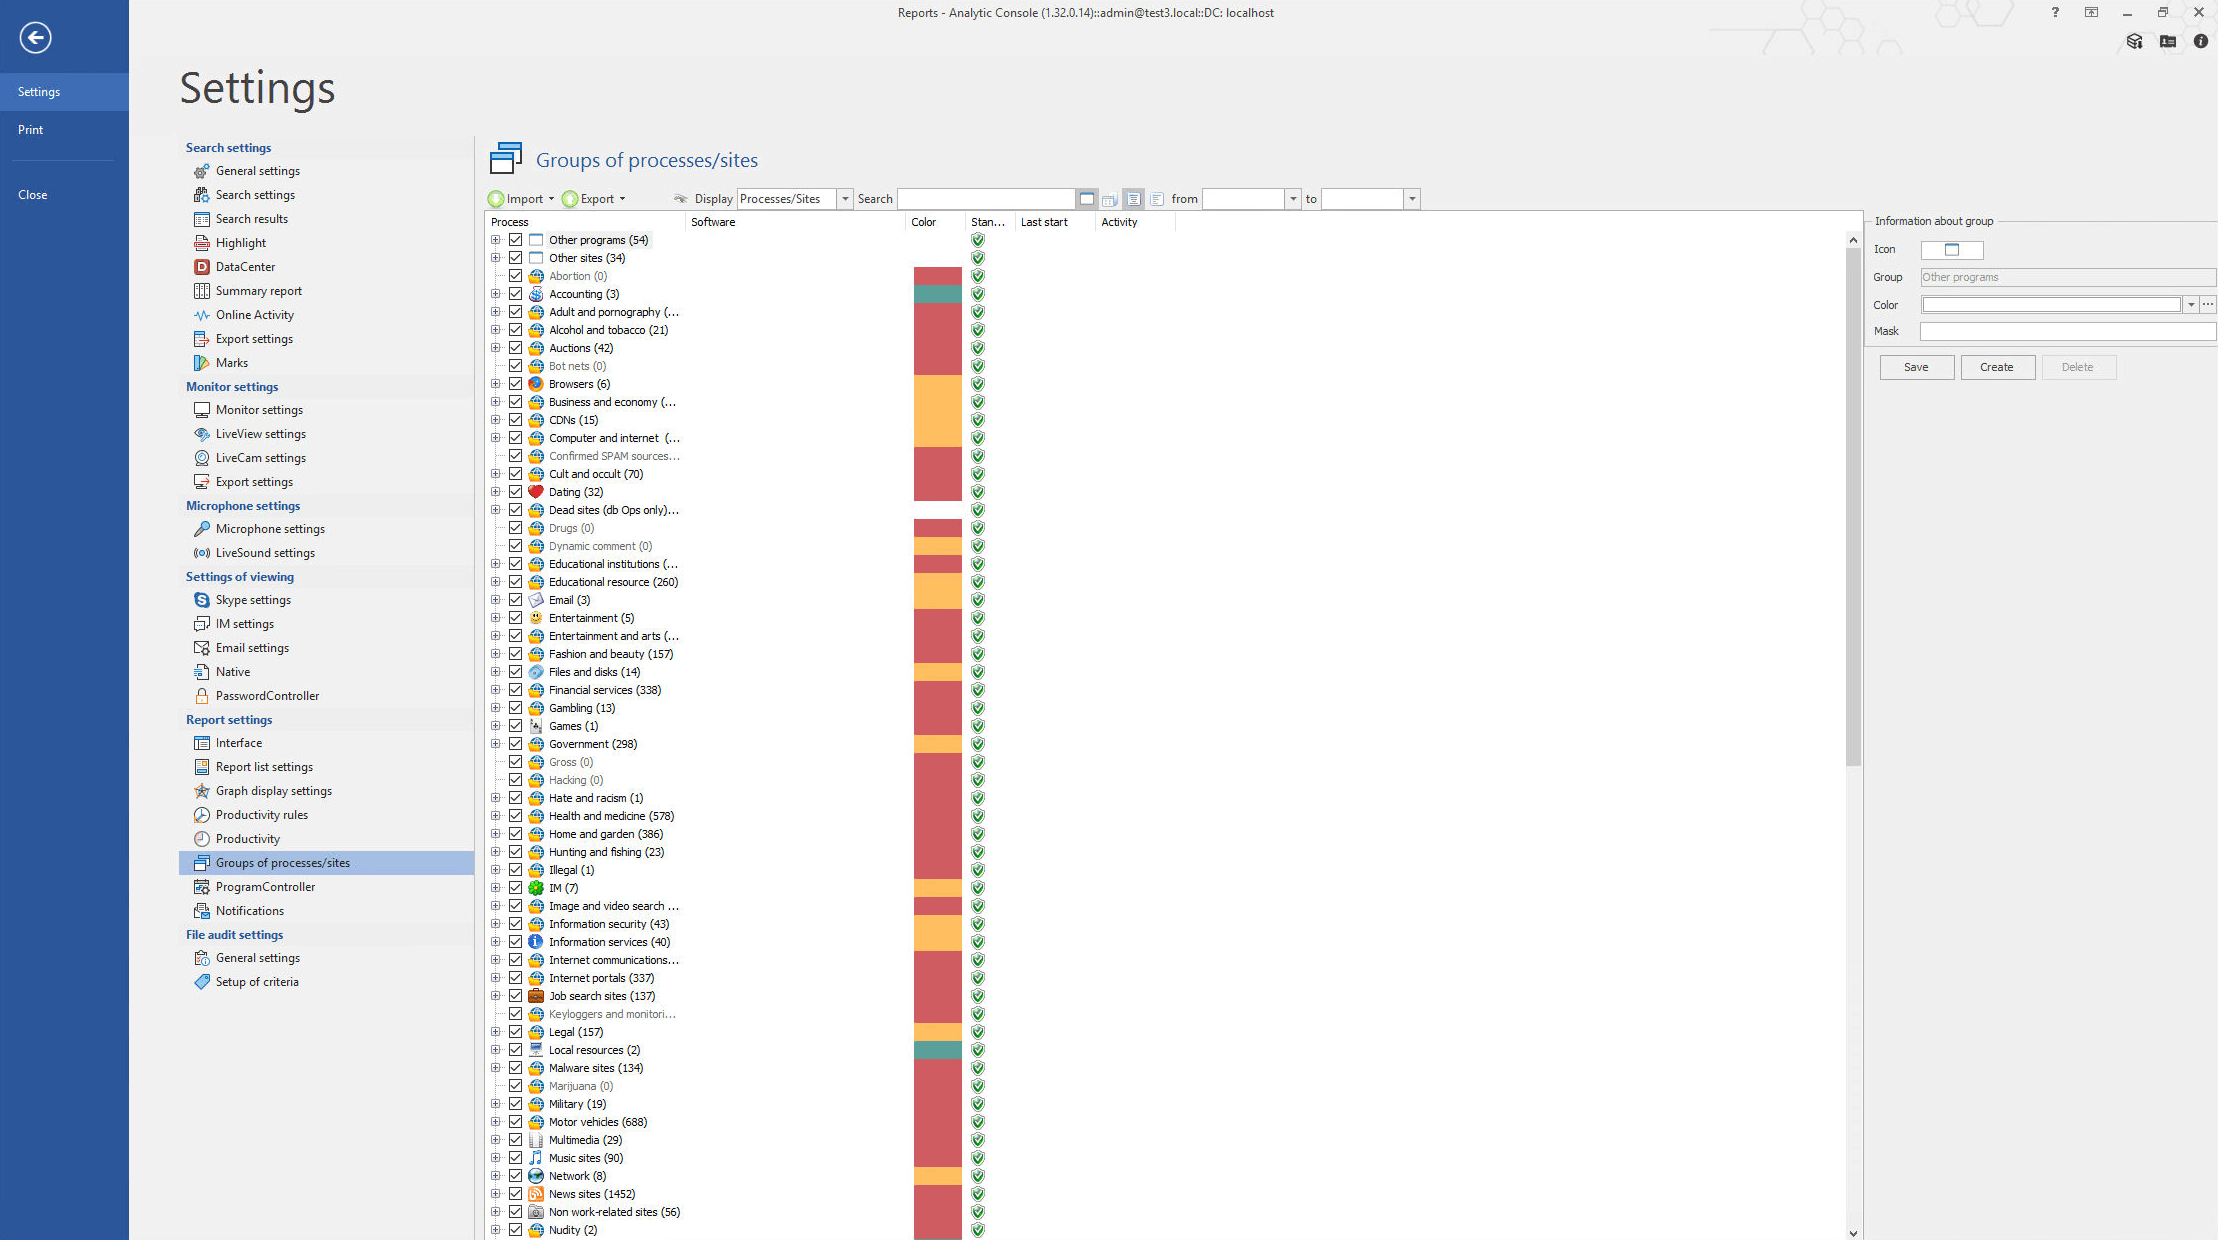
MonitorController can search for screenshots using the background process and the title of an open window, whereas events captured by DeviceController can be searched by the creation date of a file, or the date of changes made to a document uploaded to a flash drive. Usage of special keys or specific hotkeys can be tracked as well.
For fast operating of the system there are new configurable options for smart storage of captured data and load distribution among the components of the system during its processing. The number of the searched units can be limited in order not to overload the database storing the captured information. For example, if we search for mentioning of a “secret development” and it’s actually mentioned 10 times in a text, it isn’t necessary to store all of them. If a user sends this text to a suspicious destination, Risk Monitor will alert to the fact anyway and will demonstrate 2-3 captured pieces of evidence. This option is configurable.
Read Risk Monitor full functionality
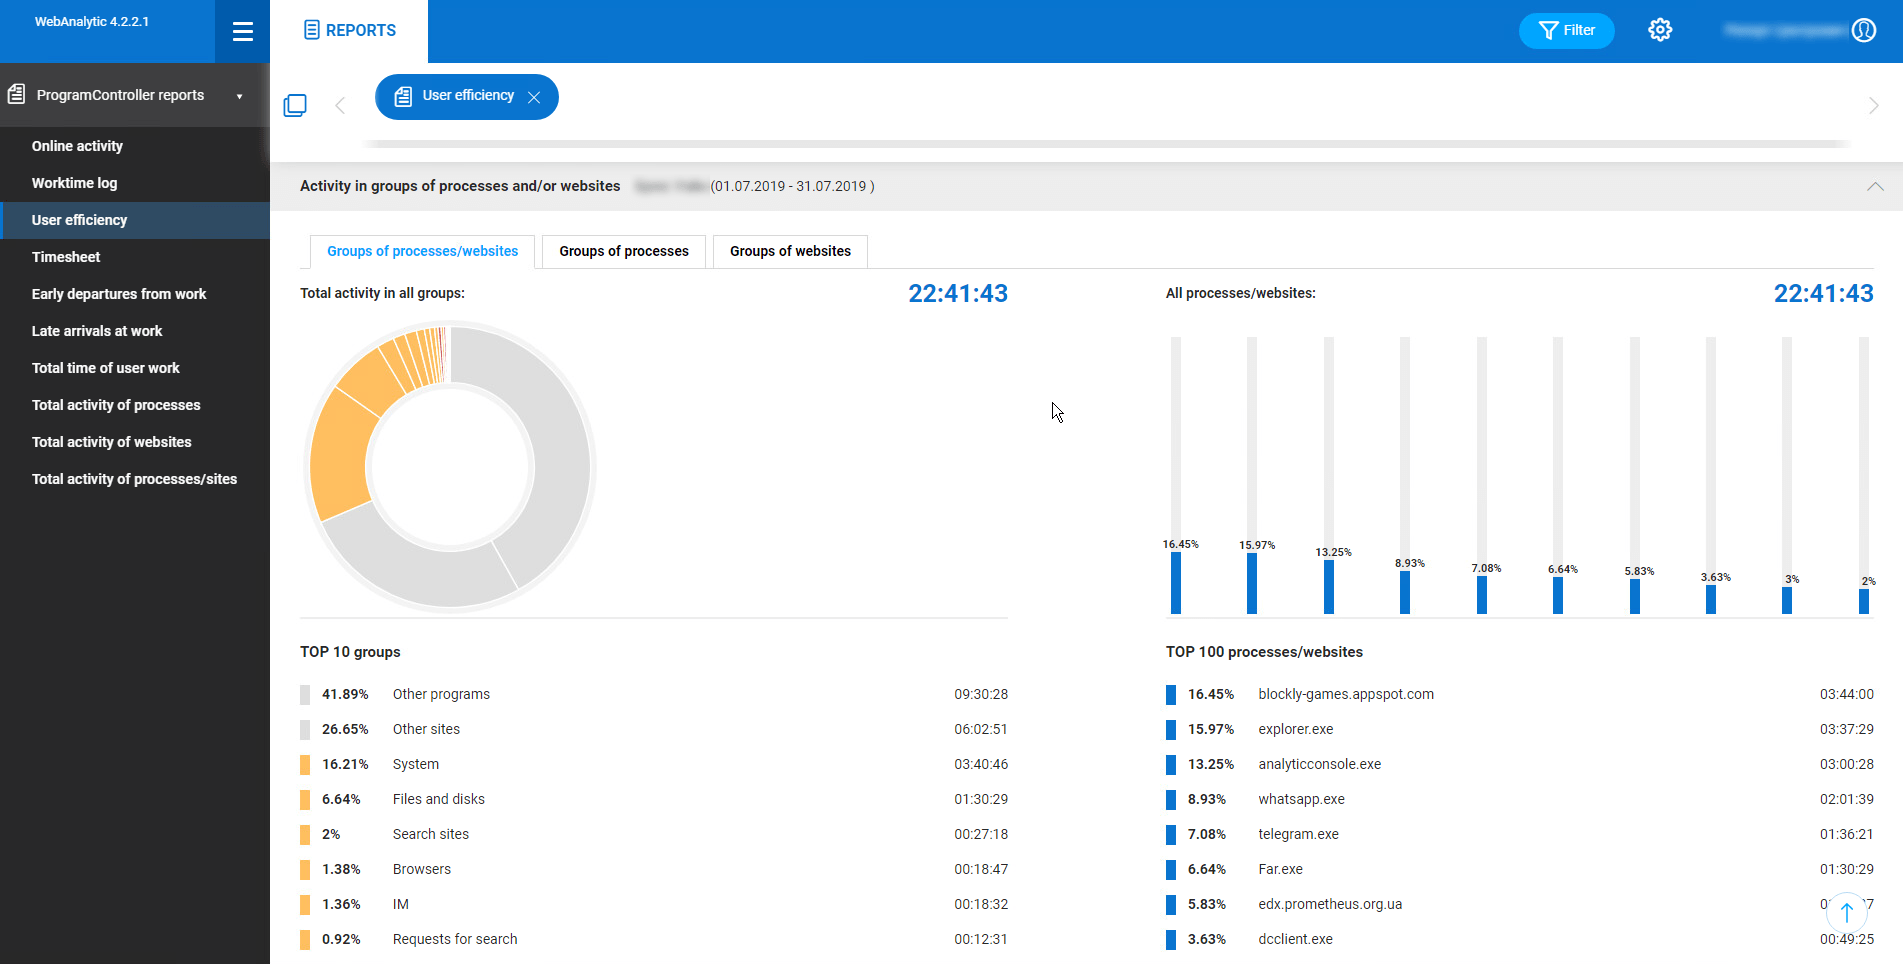
Online reports. The web console allows to receive the statistics of alerts to policy violations within a specified time period promptly. The incident dynamics can be tracked and analysed, you can monitor which events in a company’s life cause more incidents or the decrease in their number. The amount of incidents by users can be shown online as well. The reports on plugged in devices and total processes activity are available in the web console. The results can be sorted by users, processes, programs, websites and time periods, years, for example. Relation graphs can be customised in detail in the web console – shapes, colours can be tweaked to make the report visually friendly, you can even get colour shades added to the demonstrated results, and they will range in accordance with the intensity of correspondence (the more messages are sent between users – the brighter the colour is).


Subscribe to our newsletter and receive a bright and useful tutorial Explaining Information Security in 4 steps!

Subscribe to our newsletter and receive case studies in comics!