P rogrammnye products designed to protect sensitive data from leaking, stand out from the variety of IT-products for corporate use. One of the "outstanding" features is the high cost of DLP systems. Why do companies keep paying for DLP solutions? In an article for the Security Director, the founder and CEO of GlobalTrust, Alexander Astakhov, talks about a risk-based approach to assessing the economic feasibility and effectiveness of using information security tools. And as an example it uses SearchInform DLP.
Introduction
Nowadays, DLP systems are becoming more widespread, despite their high cost on the one hand and the lack of clear ideas about their economic efficiency on the other. Almost everyone has already been told about internal threats and the disastrous consequences of information leaks from the marketing departments of the developers of these systems. It's time to talk about the economics of the issue.
The DLP system is a powerful tool for protecting information, the use of which is associated, however, with a number of "side effects", such as deteriorating the moral climate in the team, as well as uneasy relations with legislation protecting the right of citizens to privacy. Investments in information security must be economically viable. A jackhammer is also a very effective tool, but it does not hammer nails. Are DLP systems economically viable? Under what conditions? For which organizations? How to evaluate their economic efficiency? How much return on investment can they provide?
Modern methods of risk analysis based on international standards provide sufficient opportunities to find answers to these questions. Let's see how this can be applied in practice.
Information leaks statistics
DLP systems are promoted by their developers using incident reports. The purpose of these reports is, of course, not to provide the most complete and reliable data for assessing the ROI of DLP systems, but to demonstrate that the problem of information leaks exists, is quite general and tends to increase.
There is no reliable data on leaks, especially in Russia. Information is taken mainly from open sources. Therefore, only high-profile cases that have leaked to the press fall into these statistics. Companies either do not keep statistics of their incidents at all, or do not provide them. Many incidents are deliberately kept secret.
Nevertheless, we need to rely on something. Plus, the leak reports are not as unreliable as they might seem. After all, all leaks can be divided into three groups according to their consequences:
1. Leaks causing damage to reputation (they all get into the media and official reports, otherwise what kind of damage to reputation can there be).
2. Leaks causing direct financial damage (as a rule, not very large and fairly easily estimated).
3. Leaks leading to the loss of competitive advantages, for example, leaks of trade secrets (such leaks are investigated in the courts and there should be judicial statistics on such cases).
In other words, leaks for which there are no official statistics are not so significant for our analysis.
Global leak statistics for 2015 (according to Zecurion Analytics) are as follows:
- The total reported damage is $ 29 billion (868 leaks).
- The average cost of a leak is ~ $ 33 million.
- Russia is in 4th place (after the USA, Great Britain and Canada) - 49 public incidents (~ $ 1,617 million).
- Individual financial data is one of the most demanded types of information by cybercriminals - 19% of incidents.
- Most often, information leaks from government agencies, retailers and banks.
The most "high-profile" leaks of 2015 from Russian companies included:
- Mail.ru and Yandex announced on the same day the launch of two-factor authentication for accessing accounts, which gives every reason to assume information leakage to competitors.
- Yandex. The insider managed to successfully copy it to a USB flash drive and bring out the source codes and algorithms for the search engine.
- Izhevsk Automobile Plant. Insiders took "secret" pictures of the new production car "Lada Vesta" and sold them to an Internet blogger.
- Bank Saint Petersburg. According to the bank's representatives, the names, account numbers, card numbers and TIN of several thousand clients fell into the hands of the attackers. Card re-issue and reputational damage. The bank declared no damage.
- Topface. On one of the forums for cybercriminals, a user base of the Russian dating service Topface was found (only addresses and nicknames).
- The passport data of members of the Federation Council was found on the public procurement portal.
More information on these leaks can be found in the media, as well as in the Zecurion Analytics report mentioned above. There are cases that could lead to a loss of competitive advantage as a result of violation of trade secrets and cases that could lead to direct financial damage (legal costs and compensation), as well as reputational damage. Could have brought, but not. According to the analysts who prepared the report, in all these cases, "the damage is not obvious."
Despite the "non-obviousness" of the damage, the data considered, as a rule, serve as a justification for purchasing a DLP system. They show customers what they should show:
- The problem exists all over the world, and Russia is in one of the first places.
- The problem is expressed in a tidy sum of $ 30 billion (and this is just the tip of the iceberg).
- The problem concerns everyone and grows from year to year.
Apparently, these considerations are enough for many managers to justify the advisability of purchasing a DLP system. However, there are still questions:
- Which of the existing DLP systems to choose, in which configuration and how much can you spend on it?
- What percentage of leaks will this DLP system prevent?
To answer these questions, it is necessary to understand the architecture of a DLP system, its functioning processes and existing limitations.
DLP system architecture
To understand which threats a DLP system is actually capable of preventing, and which not, let us consider its architecture using the example of SearchInform DLP in a somewhat simplified form.
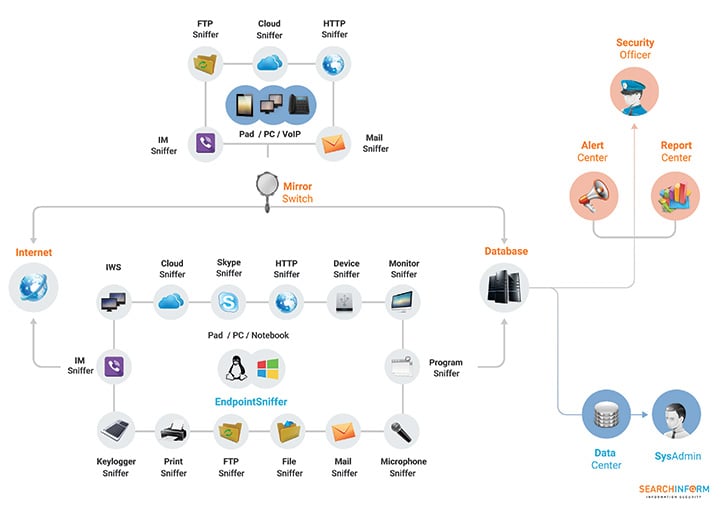
The architecture of the DLP system is multi-modular. It intercepts and analyzes information at two levels: on the network and on the host. The network modules are located on the network gateway on the NetworkSniffer platform and are responsible for network interception. Host modules are installed on user workstations on the EndpointSniffer platform and intercept information at "endpoints". In addition to the modules responsible for intercepting information, the DLP system includes server components that provide centralized management of information and all system components. Without these components, the system cannot function:
- DataCenter - control center. Monitors the health of modules, and also manages all created indexes and databases.
- SearchServer is a module responsible for indexing the intercepted information.
- AlertCenter is the "think tank" of the entire system. Interrogates all modules and, if the intercepted information contains specified keywords, phrases or text fragments, document attributes, immediately notifies security officers about this.
- ReportCenter is a reporting tool. Allows you to collect statistics on user activity and incidents related to security policy violations and present it in the form of reports.
|
Note SearchInform KIB includes a number of other components that we do not consider here for the purpose of simplification. You can read more about all modules and platforms on the developer's website. In most cases, it makes sense to purchase the maximum DLP system configuration. An exception may be cases when the client needs only 1-2 modules, for example, to control only connected devices or only printers. But in this case, it will be cheaper to look for a highly specialized solution. |
DLP system limitations
The considered architecture of a DLP system includes the following anti-leakage capabilities:
- Detect, block, investigate information leaks from the corporate network carried out by the organization's employees using regular means through the channels for which there are appropriate sniffers and which are covered by the DLP system security policy.
- Monitor the actions of users of the corporate network and monitor labor productivity.
The DLP system does not allow to counteract information leaks resulting from theft or loss of equipment and storage media, external hacking of networks and other actions not covered by the security policy. Such leaks make up a significant percentage in statistical reports.
Thus, the use of a DLP system will allow to fight only a certain part of the threats associated with information leaks. And in relation to these threats, it can only function effectively in combination with other organizational, legal and technical protection measures that provide authentication and password management, protection of the network perimeter and endpoints, control of the use and storage of media, incident management, etc. and so on. Without all this, the effectiveness of a DLP system can be reduced to zero, even for those threats that are within the boundaries of its security policy. We will need to take all these factors into account in further analysis if we are interested in the real economic efficiency and payback of a DLP system.
The effect of using a DLP system is enhanced by SIEM solutions. SearchInform SIEM monitors events in software and hardware sources, identifies information security incidents and helps to conduct investigations.
Return on investment ratio
The ultimate goal of our analysis is to estimate the return on investment for a DLP system. Return on investment (ROI) is the main economic indicator of the effectiveness of information security. It is defined as the ratio of the reduction in expected average annual losses (the amount of risk reduction) to the cost of implementing countermeasures:
[Return on Investment (ROI)] = ([Average Annual Loss Reduction (ALE)] - [Cost of Safeguards (TCO)]) / [Cost of Safeguards (TCO)]
ROI shows how many times the amount of potential damage exceeds the cost of preventing it. Possible ROI values:
- ROI = 0, how much you invested, you saved so much (won or lost nothing);
- ROI <0, DLP cost exceeds potential damage (money and time were wasted);
-
0
- ROI = 1, we get 100% savings on investment;
- ROI> 10, the expected reduction in losses is an order of magnitude higher than costs.
|
Note Although we are talking about investments in information security, we should not confuse this with ordinary investments, which are much better calculated and for which ROI = 1 is an excellent result (100% annual profit). Investments in safety are more like insurance, and the insurance premium can be less than 1% of the value of the insured property. This corresponds to ROI values> 100. ROI for a DLP system should be approximately the same. If the ROI is <10, the insurance premium is too high. Would you like to insure your car or apartment, for example, for 20% of its value per year? |
The main economic goal of information security is to ensure the optimal level of return on investment in security, i.e. maximizing ROI, as shown in the graph. For this, it is necessary not only to assess the risks, but also to register, analyze and count the direct and indirect losses as a result of incidents.
The diagram shows the problem areas with negative return on investment: the underfunding area and the overfunding area. In the first case, money for security is not allocated, or allocated on a leftover basis. This case is characterized by problems with viruses, a lack of business continuity plans and a frivolous attitude of staff to security issues. In the second case, there is excess funding for security, but most of the funds are wasted. This case is characterized by the prosperity of the bureaucracy, excessive formalization, the acquisition of expensive equipment without taking the necessary organizational measures.
A simple formula ROI = ALE / TCO can provide answers to all the economic questions of information security. ROI> 10 is good, ROI <10 is bad, ROI <0 is disgusting. In this formula, the cost of ownership (TCO) is fairly easily and accurately calculated, while the risk (ALE) is a function of several non-linear, uncertain quantities such as incident rate, vulnerability magnitude, and asset value.
Ownership cost
We will move from simple to complex, so let's start with a cost of ownership (TCO) estimate. It is estimated for a DLP system using the following formula:
Investments in DLP = One-time costs (survey, design, purchase of software and equipment, implementation, training, consulting, development of the ORD, acceptance tests) + Fixed costs (technical support, renewal of subscriptions, administration and operation)
Technical support will include:
- software update (release of new versions, expansion of functionality, optimization of work, bug fixes, etc.);
- engineering services (for example, if the client for some reason cannot or does not know how to split the indexes, configure the automatic launch of a component, register alternative server addresses, etc.);
- initial training in terms of analytics (creating and configuring policies, drawing up reports, etc.) and further support from the developer's implementation department.
DLP system implementation works usually include:
- filling out a questionnaire (to determine the composition of equipment, software and work planning);
- preparation for test implementation;
- test implementation (may include benchmarking tests, load testing, etc.);
- deployment (installation) of a DLP system;
- primary training;
- setting up security policies;
- analysis of intercepted information and generation of reports.
The cost of these works, in this case, is included in the above license cost. In general, for DLP systems, it can average about 10-20% of the product cost.
Among other things, the functioning of the DLP system should be supported by a set of organizational and legal measures, the documentation of which is carried out during the development of a set of organizational and administrative documents.
Risk formula
Now we turn to assessing the risk of information leakage, which is quantitatively determined by the value of the probable average annual damage (ALE) and is calculated using the formula
Risk value = Threat probability x Vulnerability value x Damage
In this formula:
- Threat probability - the average number of information security incidents per year;
- Vulnerability size -% of successful incidents out of the total number of incidents;
- The amount of damage is the total cost of compromised information assets, expressed in the corresponding losses of the organization from successful incidents.
In our case, only those threats associated with information leakage, protection from which is provided by the DLP system, will be considered, and information critical from the point of view of confidentiality will be considered as information assets. Such information may include: personal data, financial information and various types of secrets determined by law.
BSI / ISO / GTS Risk Management Methodology
To assess the above risk factors, it will be necessary to go through all the steps provided for by the IS risk assessment methodology, which was originally described in the 3rd part of the British standard BS 7799-3, laid down in the basis of the international standards of the ISO 27000 series, and adapted by GlobalTrust for practical use.
The main document that is formed based on the results of applying this methodology is the IS risk profile, which describes all the risk factors for a specific protected object and determines all the necessary numerical indicators for a quantitative assessment of risks and return on investment in IS.
Risk assessment begins with an inventory of assets and an assessment of their business value. The value of an asset is expressed in the amount of potential damage that can be caused as a result of its compromise. Damage assessment is carried out during the analysis of the consequences of incidents.
For information leakage incidents, there are three types of consequences:
1. Loss of competitive advantage, lost profit (for example, as a result of know-how or customer base leakage).
2. Damage to reputation (for example, as a result of leakage of customer personal data, banking secrets or internal financial statements).
3. Direct financial damage: legal costs, fines from regulators, compensation to victims, costs of eliminating the consequences of the incident (for example, as a result of data leakage of third parties, customers, partners or contractors).
Relevant scenarios of the potential consequences of leaks are considered for each group of critical information assets of the organization, while the worst-case and most likely scenario are assessed. The results obtained are compared with the average estimates obtained by various researchers.
Assessment of the consequences of information leaks
The average cost of leaks can range from $ 1.5 million (according to Forrester Research) to $ 4.8 million (according to the Ponemon Institute), or be comparable to the organization's average monthly turnover.
Let's use Forrester Research calculations as an example. In order to assess the consequences of compromising a database (for example, ISDN), it is necessary to assess the direct costs of the organization per one database record. Four cost items are considered:
1. Organizational costs of identifying, responding, investigating and reporting an incident.
2. Loss of productivity of employees in the organization as a result of the incident.
3. Compensation payments to affected clients.
4. Loss of competitiveness.
Estimates of these costs are tabulated.
DIRECT COST OF LEAKAGE PER RECORD
|
Cost category |
Description |
Cost per entry, dollars |
|
Investigation, response and alert |
Paying fines, notifying customers, increasing the load on the call center, marketing and PR, offering discounts on products |
fifty |
|
Reduced worker productivity |
Distracting employees from performing work procedures, attracting contractors |
thirty |
|
Compensation for damages |
Compensation for direct damages to clients affected by the incident |
thirty |
|
Missed opportunities |
Loss of future business opportunities |
98 |
|
Total direct costs per entry |
|
218 |
So, for example, if there was a leak of a customer base of 100,000 records, then, according to these calculations, direct damage would be $ 21.8 million.
Further, the consequences of reputational damage for a company with an annual turnover of $ 1 billion are estimated. It can be expressed in the loss of 10% of the existing customer base and 20% of new customers, which is a total of $ 120 million, 12% of revenue or more than 60% of gross profit.
ESTIMATED IMPACT OF LEAKAGE ON REVENUE
|
Repeat clients |
New clients |
Total |
|
|
Total annual revenue in dollars |
800 million |
200 million |
1 billion |
|
Business losses as a percentage of revenue |
ten% |
twenty% |
12% |
|
Business losses in dollars |
80 million |
40 million |
120 million |
The impact of reputational damage on an organization's profits is shown in the following table. Direct costs and reputational losses add up. We get the figures for the lost profit over a 5-year period.
ESTIMATED IMPACT OF LEAKAGE ON REVENUE OVER 5 YEARS (in USD)
|
|
1st year |
2nd year |
3rd year |
4th year |
5th year |
|
Annual revenue (expected 8% growth) |
1,000,000,000 |
1,080,000,000 |
1,166,400,000 |
1,259,712,000 |
1,360,488,960 |
|
Annual net profit (assumed margin of 20%) |
200,000,000 |
216,000,000 |
233,280,000 |
251,942,400 |
272,097,792 |
|
Annual cost of repairing a leak |
12,220,000 |
8,450,000 |
5,770,000 |
4,680,000 |
4,680,000 |
|
Business loss |
120,000,000 |
129,600,000 |
139,968,000 |
151,165,440 |
163,258,675 |
|
Total loss from leakage |
132,220,000 |
138,050,000 |
145,738,000 |
155,845,440 |
167,938,675 |
|
Resulting annual net profit |
67,780,000 |
77,950,000 |
87,542,000 |
96,096,960 |
104,159,117 |
|
Decreased profitability due to leakage |
66% |
64% |
62% |
62% |
62% |
For clarity, the following chart shows the projected profit of the organization before and after the incident.
Estimated impact on profitability
Comparison of profitability
- Annual net profit (assumed 20% margin);
- Annual net profit (including loss from leakage).
Now the potential damage from a leak can be compared to the cost of a DLP system. If we consider the ratio of the cost of a subscription to Websense Data Protect (one of the leaders in the global DLP market) per 100,000 users and total losses from leaks, then on average it is 0.15%. This figure corresponds to the size of the insurance premium, if we consider the costs of information security as insurance against the corresponding risks.
Estimating the likelihood of information leaks
Thus, we received an estimate of the potential damage from information security incidents and an estimate of the cost of ownership for a DLP system over a five-year period. To determine the value of risk (ALE) and the corresponding value of the return on investment (ROI), it remains to assess the likelihood of incidents (threats). This probability, among other things, will depend on the settings of the DLP system's security policies, which determine the threat model against which it provides protection.
THREAT MODEL FOR DLP SYSTEM (SearchInform AlertCenter policies)
To roughly estimate the frequency of these threats, analysis of the DLP system event log can be used, which records all suspicious events that potentially violate the security policy.
FREQUENCY OF THREATS (IS events SearchInform AlertСenter)
|
Logins and passwords (Information about people) |
4816 |
|
Correspondence via unincorporated mail (Using personal mail) |
4150 |
|
Online movie sites (Waste of time and resources) |
2642 |
|
Personal mail (Using personal mail) |
1258 |
|
Bank card messages (Information about people) |
618 |
|
Visiting Job Sites (Disloyal Employees) |
389 |
|
Dating Sites (Waste of Time and Resources) |
347 |
|
Dangerous (Suspicious subject) |
215 |
|
Resume Search (Disloyal Employees) |
193 |
|
Non-Business Use of the Printer (Waste of Time and Resources) |
176 |
|
Fraud (Suspicious subject) |
111 |
|
Recoil topic 2 (Suspicious topic) |
108 |
|
Social media posts (Waste of time and resources) |
94 |
|
Credit Card (People Information) |
47 |
|
List of months (Document control) |
44 |
|
Online games (Waste of time and resources) |
37 |
|
Recoil topic (Suspicious topic) |
36 |
However, the DLP system detects not incidents related to leaks, but information security events (tens and hundreds of thousands per month) that can potentially be incidents. There is no way to block all detected events, which means there is no way to prevent possible leaks. Therefore, statistics are also needed: how many real incidents were and how many of them were prevented. Comparing this with general and industry statistics, it would be possible to accurately estimate the likelihood (frequency of implementation) of security incidents (threats).
Estimation of average annual losses from information leaks
Now, using the risk formula, you can calculate the predicted average annual losses from information leakage:
Average annual losses (ALE) = [Threat occurrence frequency] x [Vulnerability magnitude] x [Damage magnitude]
Let's calculate ALE before and after the implementation of the DLP system. As the average damage, let us take the "average for the hospital" according to the statistics of incidents available to us for 2015 - $ 33 million.
The magnitude of the vulnerability shows the effectiveness of DLP. To illustrate, let's assume that the very fact of using DLP reduces the number of incidents by an order of magnitude. And the number of successful ones decreases by an order of magnitude. Therefore, after that, the frequency of the threat and the magnitude of vulnerability in our country decrease accordingly.
Based on these assumptions, we will calculate the effect of the implementation of a DLP system (decrease in average annual losses).
|
|
Before implementation |
After implementation |
|
Threat implementation frequency (incidents in 1 year) |
0.02 |
0.002 |
|
Vulnerability size (% of successful attempts to drain) |
0.95 |
0.1 |
|
Amount of damage (thousand rubles) |
2,145,000 |
2,145,000 |
|
Average annual damage (ALE) |
40755 |
429 |
In this table:
- Threat frequency = number of incidents per year / number of organizations.
- The amount of damage (the value of all assets protected by the DLP system) = the average cost of a similar leak.
14.12.2020